You know the advice to visualise your data, that will help you understand. It doesn't help with this project.
I'm okay with data that makes no sense because of external factors, for instance the equivalent diagrams for the England Rugby Union team at the 2023 World Cup, where Borthwick had to play George Ford for the first 3 games because Owen Farrell was banned, and then started to play Farrell the minute he could, which meant that the visualisations looked really messy in games 4, 5 and 6.
But there's nothing like this.
Now partly, it might be that there will only ever be 3 games worth of data for the England men's rugby league team at the 2026 World Cup and less data is always more confusing, because the signal to noise is lower.
But I can't shake the feeling it's this messy because Brian McDermott didn't know who his ideal matchday 17 should be.
After 3 games, when do England score?
( Under the cut )
No major patterns.
The "when do England concede" diagram is even less revealing because the opposition in one of the games (France) didn't even score.
( When do England concede, overlaid with opponent )
There is no overlap of point-conceding minutes. It just looks intriguing.
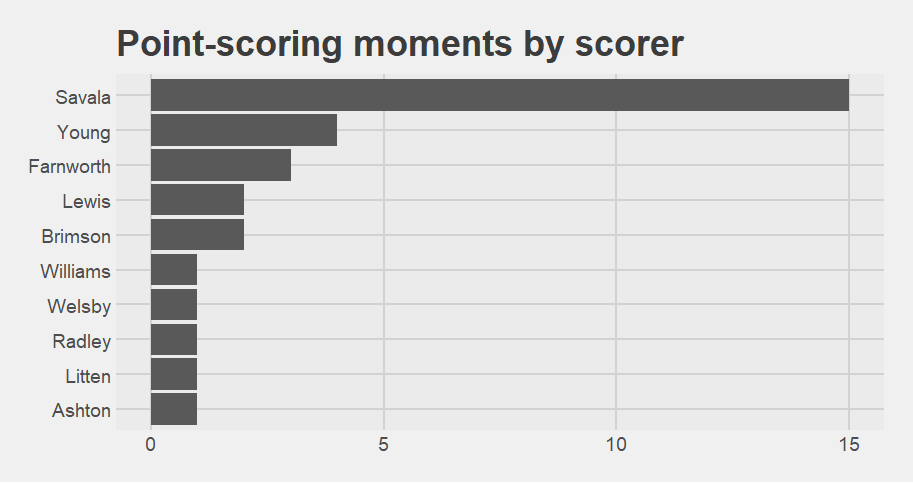
Who scores for England?
( Bar chart under the cut )
12 different players scored for England. Savala, who was the kicker for all but the final 15 minutes of the Papua New Guinea game, is understandably way ahead of everyone else on 19 point-scoring moments.
Next highest is Dom Young on 5.
Which players are on the pitch when England score?
( Under the cut )
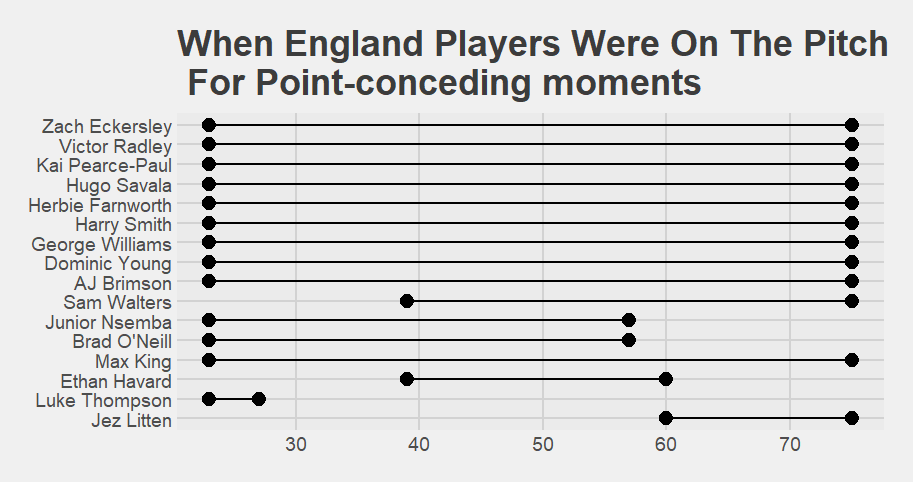
Which players are on the pitch when England concede?
( Under the cut )
Comparing the position on the "present when England score chart" vs the "present when England concede chart", is screwed up by there being 21 players on the "score" chart and 19 players on the "concede" chart, but the major differences are:
Williams is 10 places higher on the concede chart.
Eckersley is 9 places higher (but I think that's because he played the game vs Tonga but not the other two games)
Havard and O'Neill are 6 places higher
Ashton is 10 places lower on the concede chart, but I think that's because he didn't play the Tonga game.
Thompson is 5 places lower on the concede chart.
So is Litten, and that's interesting because he played in all three games. I told you he was good.
The mix and matchiness of England's team and combinations, and the outsize effect of the France game on both the points-scored and points-conceded moments, mean the matrix and network graphs are a little unusual. I'm going to start with the points-scored diagrams, because the lack of point-conceding moments in the France game has had some interesting effects.
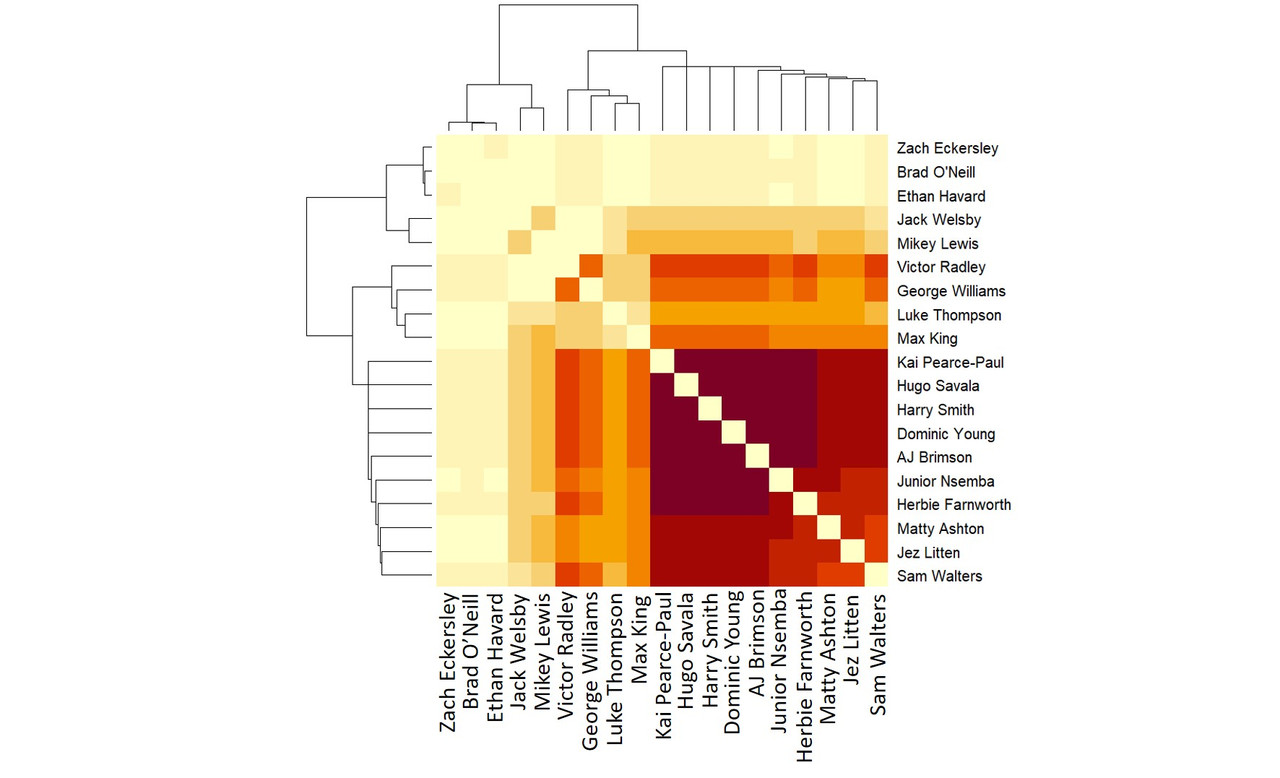
The point-scoring moments matrix diagram and network diagram:
( Matrix chart )
The odd Radley and Thompson dark zone at the top left is possibly an artefact of Radley not playing against Papua New Guinea.
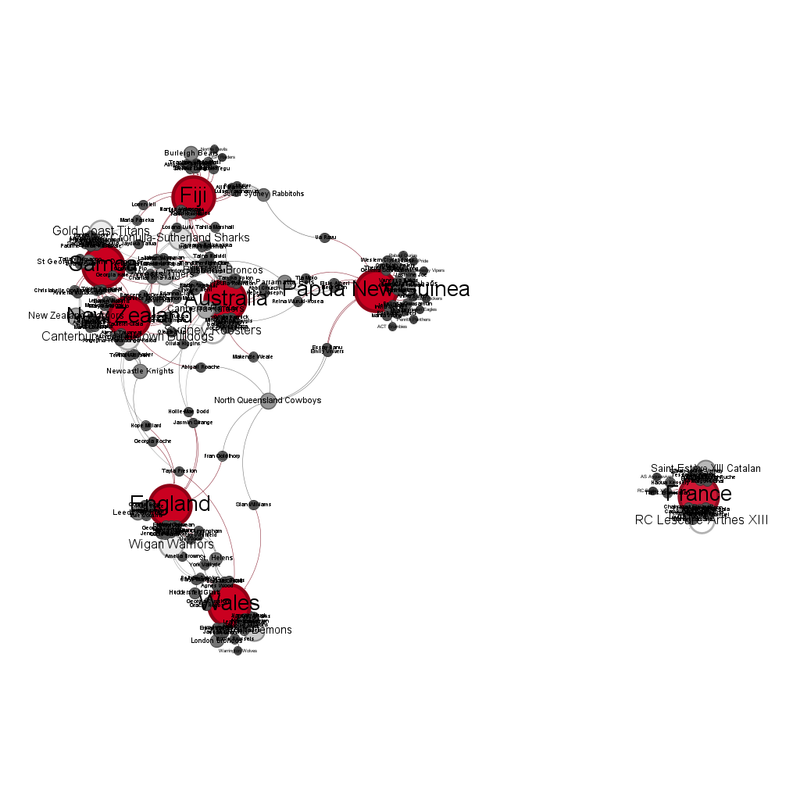
( Network graph of players together at England point-scoring moments )
This makes sense because Welsby and Lewis didn't play vs Tonga and Knowles only played against Papua New Guinea.
I <3 Morgan Knowles an entirely unreasonable amount, but I don't think players who aren't fit enough to be available for every game. (I mean, he was awesome in the game he did play in and if England had had him against Tonga how might that have gone etc etc.)
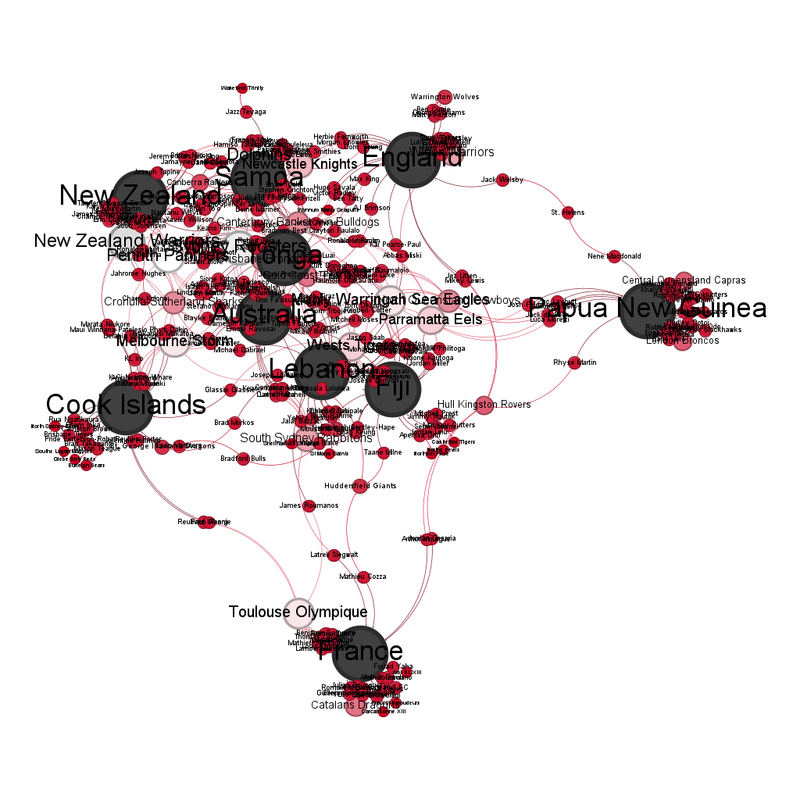
The "point-conceding" graphs intrigue me because, due to France not scoring, we can directly compare the vs Tonga and vs Papua New Guinea squads.
In an "ideal" world, there would be one very dark area of "play together most often", followed by increasingly paler areas. That does almost happen.
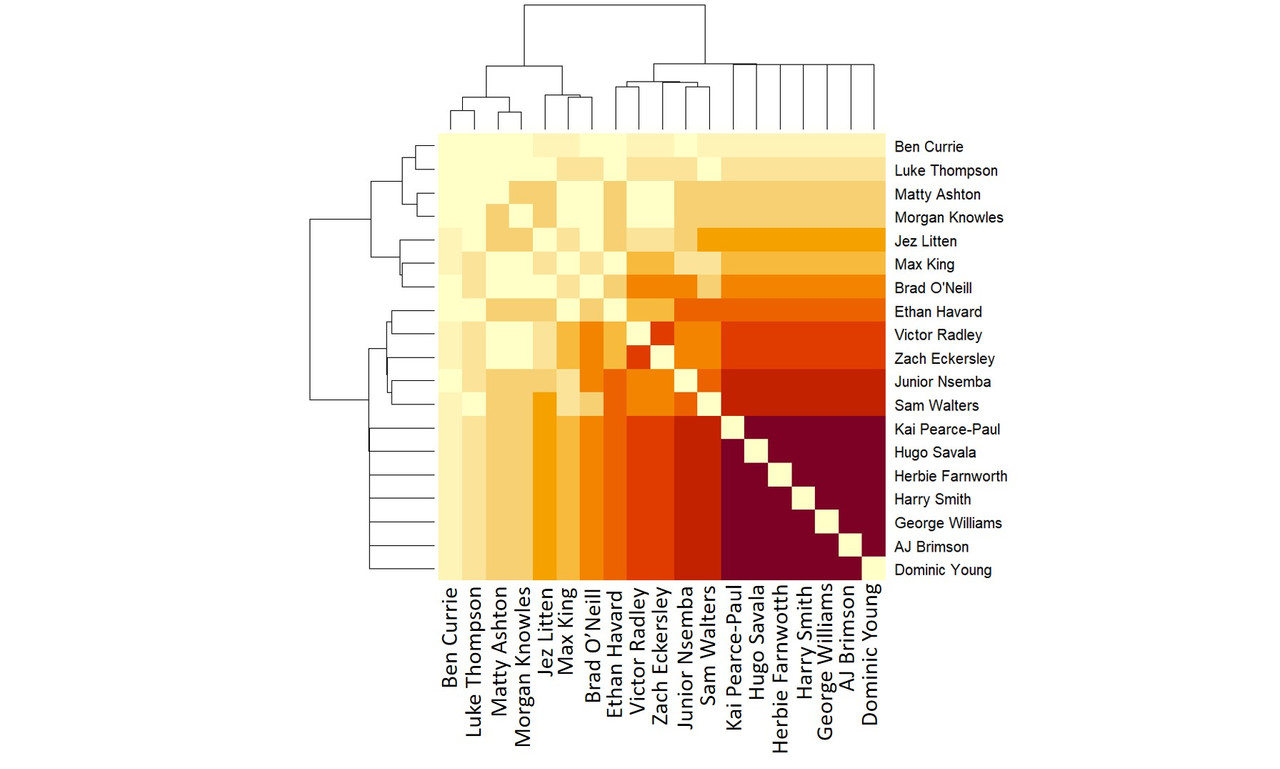
The part where it doesn't happen is interesting. Jez Litten's row is darker than Max King who lies between him and the darker areas. I think that's because Litten played more vs Papua New Guinea where England scored more, while King played in both games, even if he was subbed on/off more.
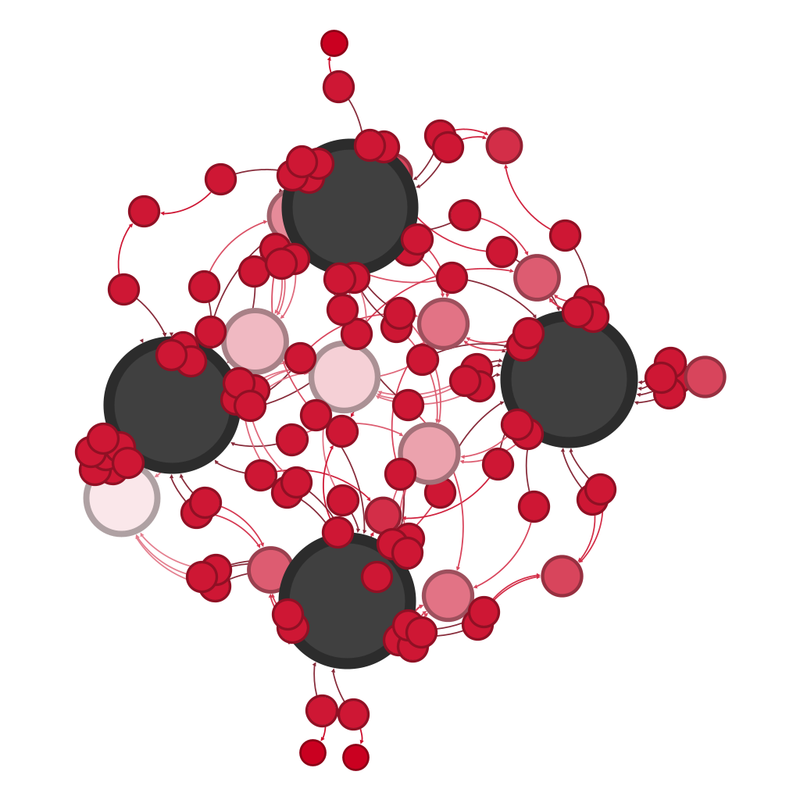
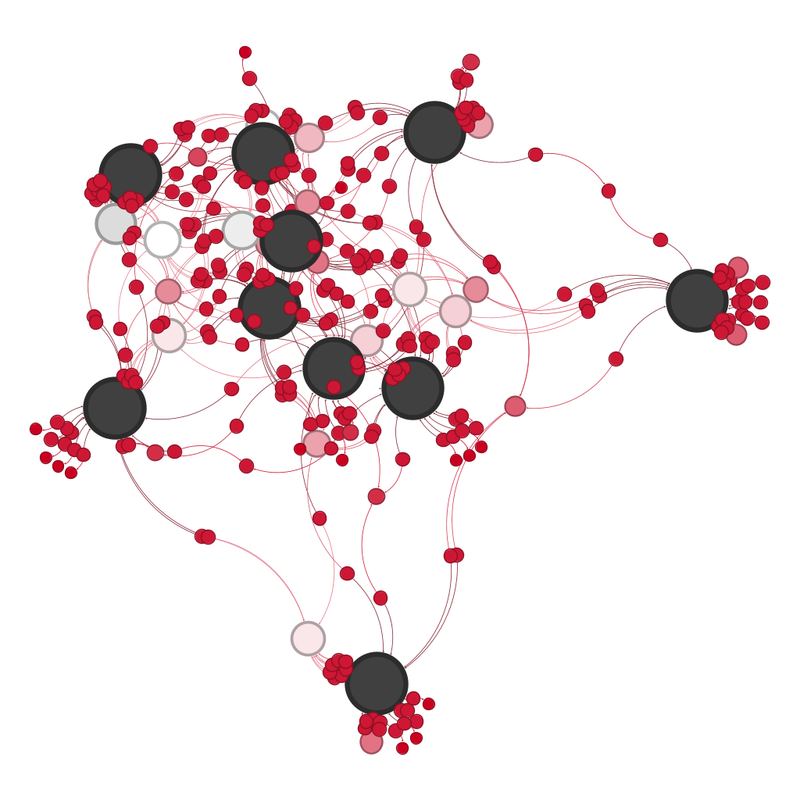
The network graph also makes sense.
( Under the cut )
Three things stand out:
1 - There are only 13 people in the diagram. A matchday squad is 17 + 1 emergency replacement. I don't think that McDermott knew what the 17 were.
2 - Eckersley is on it despite him only playing one game. I fear he was used as the scapegoat.
3 - Savala isn't right in the centre despite scoring most of England's points. He only missed 3 of England's point scoring moments but that was enough to shove him slightly out.
I'd also like to thank nrl.com for all the data. Their website is significantly more useful than the official one.
I'm okay with data that makes no sense because of external factors, for instance the equivalent diagrams for the England Rugby Union team at the 2023 World Cup, where Borthwick had to play George Ford for the first 3 games because Owen Farrell was banned, and then started to play Farrell the minute he could, which meant that the visualisations looked really messy in games 4, 5 and 6.
But there's nothing like this.
Now partly, it might be that there will only ever be 3 games worth of data for the England men's rugby league team at the 2026 World Cup and less data is always more confusing, because the signal to noise is lower.
But I can't shake the feeling it's this messy because Brian McDermott didn't know who his ideal matchday 17 should be.
After 3 games, when do England score?
( Under the cut )
No major patterns.
The "when do England concede" diagram is even less revealing because the opposition in one of the games (France) didn't even score.
( When do England concede, overlaid with opponent )
There is no overlap of point-conceding minutes. It just looks intriguing.
Who scores for England?
( Bar chart under the cut )
12 different players scored for England. Savala, who was the kicker for all but the final 15 minutes of the Papua New Guinea game, is understandably way ahead of everyone else on 19 point-scoring moments.
Next highest is Dom Young on 5.
Which players are on the pitch when England score?
( Under the cut )
Which players are on the pitch when England concede?
( Under the cut )
Comparing the position on the "present when England score chart" vs the "present when England concede chart", is screwed up by there being 21 players on the "score" chart and 19 players on the "concede" chart, but the major differences are:
Williams is 10 places higher on the concede chart.
Eckersley is 9 places higher (but I think that's because he played the game vs Tonga but not the other two games)
Havard and O'Neill are 6 places higher
Ashton is 10 places lower on the concede chart, but I think that's because he didn't play the Tonga game.
Thompson is 5 places lower on the concede chart.
So is Litten, and that's interesting because he played in all three games. I told you he was good.
The mix and matchiness of England's team and combinations, and the outsize effect of the France game on both the points-scored and points-conceded moments, mean the matrix and network graphs are a little unusual. I'm going to start with the points-scored diagrams, because the lack of point-conceding moments in the France game has had some interesting effects.
The point-scoring moments matrix diagram and network diagram:
( Matrix chart )
The odd Radley and Thompson dark zone at the top left is possibly an artefact of Radley not playing against Papua New Guinea.
( Network graph of players together at England point-scoring moments )
This makes sense because Welsby and Lewis didn't play vs Tonga and Knowles only played against Papua New Guinea.
I <3 Morgan Knowles an entirely unreasonable amount, but I don't think players who aren't fit enough to be available for every game. (I mean, he was awesome in the game he did play in and if England had had him against Tonga how might that have gone etc etc.)
The "point-conceding" graphs intrigue me because, due to France not scoring, we can directly compare the vs Tonga and vs Papua New Guinea squads.
In an "ideal" world, there would be one very dark area of "play together most often", followed by increasingly paler areas. That does almost happen.
The part where it doesn't happen is interesting. Jez Litten's row is darker than Max King who lies between him and the darker areas. I think that's because Litten played more vs Papua New Guinea where England scored more, while King played in both games, even if he was subbed on/off more.
The network graph also makes sense.
( Under the cut )
Three things stand out:
1 - There are only 13 people in the diagram. A matchday squad is 17 + 1 emergency replacement. I don't think that McDermott knew what the 17 were.
2 - Eckersley is on it despite him only playing one game. I fear he was used as the scapegoat.
3 - Savala isn't right in the centre despite scoring most of England's points. He only missed 3 of England's point scoring moments but that was enough to shove him slightly out.
I'd also like to thank nrl.com for all the data. Their website is significantly more useful than the official one.