Game 17 was another loss to Salford. Let us never speak of it again.
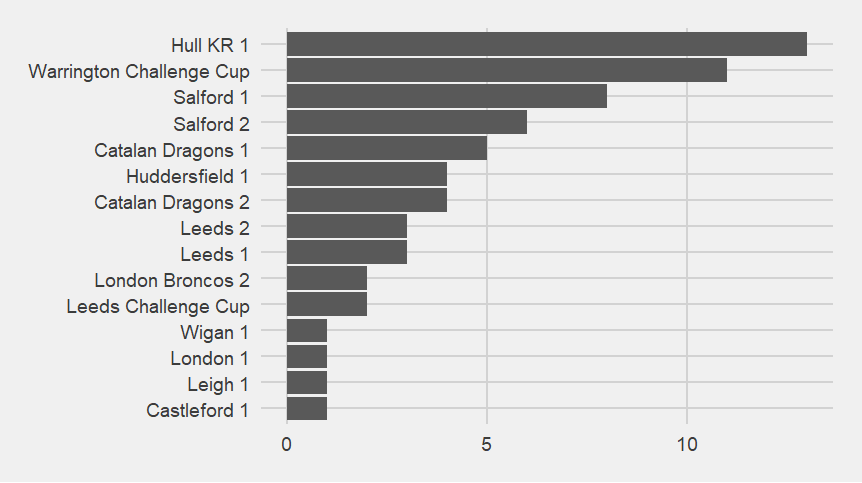
More sensibly, both times Salford played Saints this season are high up on the "who scores against Saints?" chart.
Mostly concerned about Sam Royle going off concussed.
Looking at the year to date:
Percival's try and the conversions help extend his lead at the top of the "Who scores for Saints?" chart:
( Under the cut )
There is still no real pattern to when Saints score.
( Under the cut )
Welsby is still ever present.
( Under the cut )
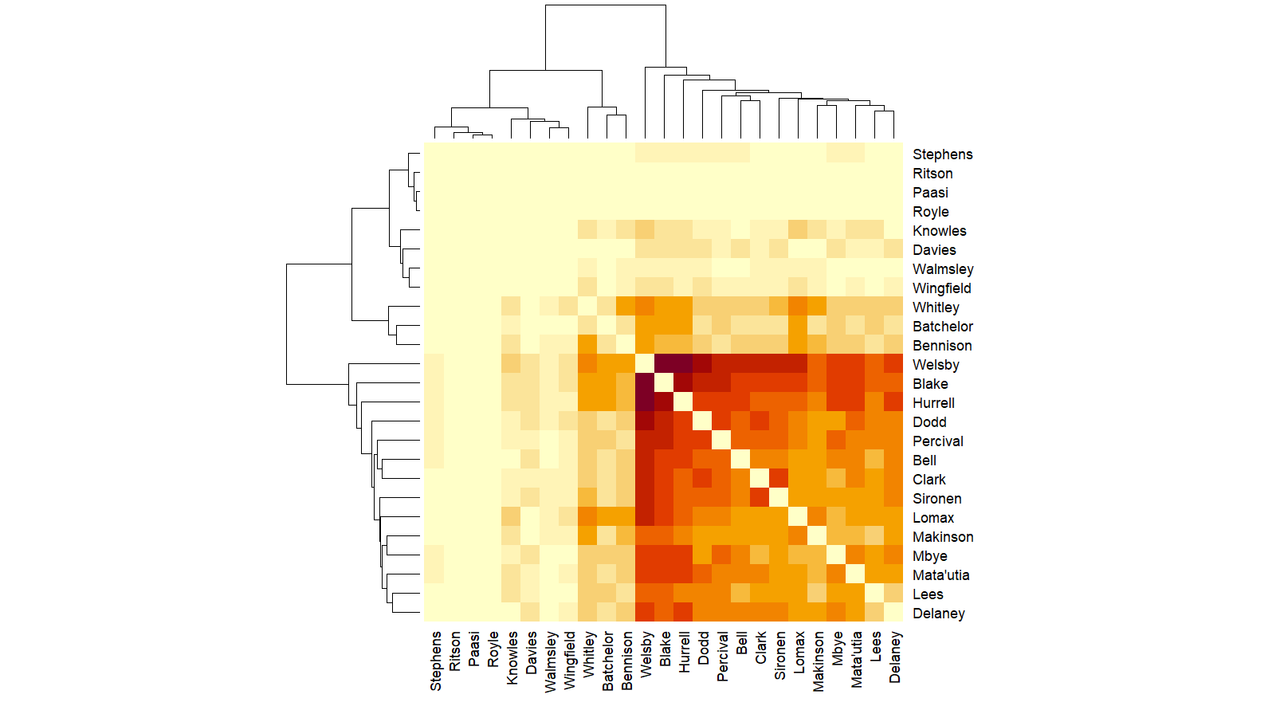
Unlike the matrix for when Saints concede, the "who is together when Saints score" matrix looks like the way I'd expect, with one corner (the bottom right) darker than the others, then the square getting paler as you move up or left.
The network graph equivalent just looks weird.
( Under the cut )
When do Saints concede?
( Under the cut )
There are two lumps one from minute 9-11, and the other, less high but longer, from minute 71-80.
Saints have conceded 65 point-scoring moments up to the end of game 17, and 9 of them (almost 14%) have come in minutes 9-11. 16 (almost 25%) have come in minutes 71-80.
Who is present when Saints concede?
( Bar chart under the cut )
The "which players are together most often when Saints concede" image is intriguing, and looks different to the scoring one. Rather than there being a darker area, then pale, it goes dark, paler, darkest, palest.
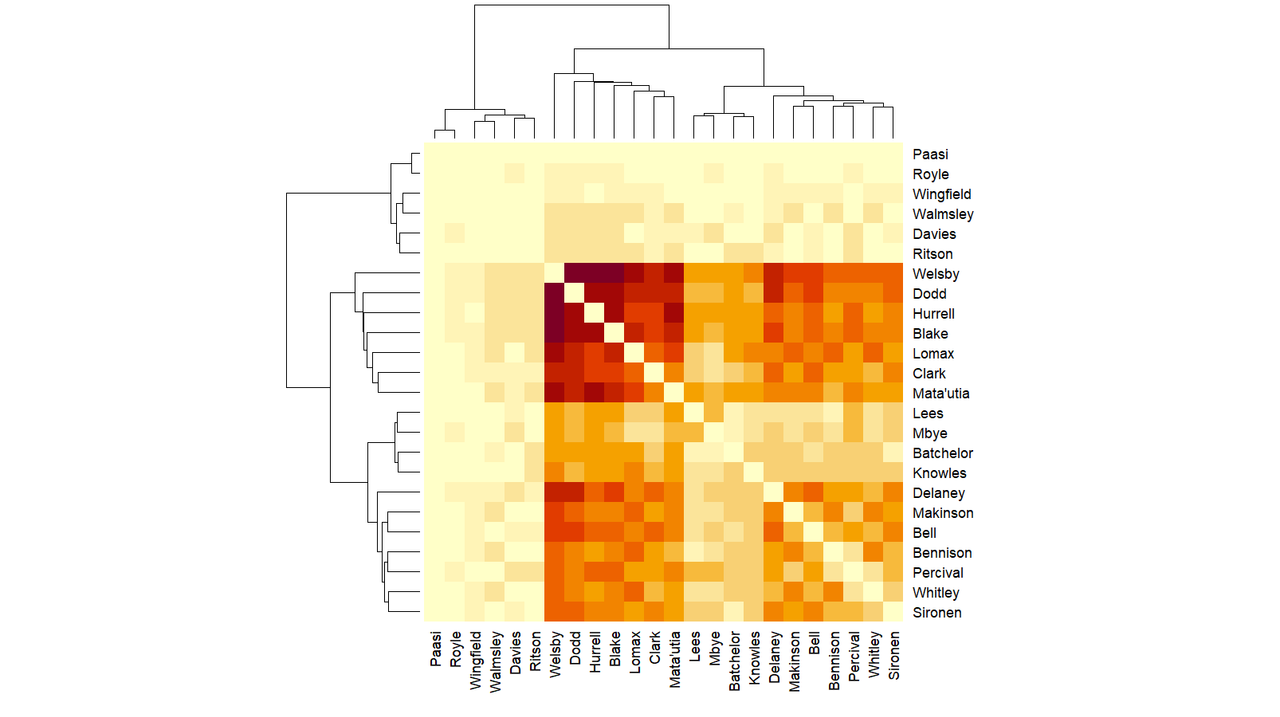
Lees, Mbye, Batchelor and Knowles being an intermediate colour makes sense because they're props and other forwards who are rotated on and off (not to mention the various cards). I think the mixing of the patches rather than the clear separation seen in the "present when point-scoring" matrix is because Percival is no longer hauled off at minute 50.
On the other hand, the "present when Saints concede" network graph looks more reasonable than the scoring one.
( Below the cut )
More sensibly, both times Salford played Saints this season are high up on the "who scores against Saints?" chart.
Mostly concerned about Sam Royle going off concussed.
Looking at the year to date:
Percival's try and the conversions help extend his lead at the top of the "Who scores for Saints?" chart:
( Under the cut )
There is still no real pattern to when Saints score.
( Under the cut )
Welsby is still ever present.
( Under the cut )
Unlike the matrix for when Saints concede, the "who is together when Saints score" matrix looks like the way I'd expect, with one corner (the bottom right) darker than the others, then the square getting paler as you move up or left.
The network graph equivalent just looks weird.
( Under the cut )
When do Saints concede?
( Under the cut )
There are two lumps one from minute 9-11, and the other, less high but longer, from minute 71-80.
Saints have conceded 65 point-scoring moments up to the end of game 17, and 9 of them (almost 14%) have come in minutes 9-11. 16 (almost 25%) have come in minutes 71-80.
Who is present when Saints concede?
( Bar chart under the cut )
The "which players are together most often when Saints concede" image is intriguing, and looks different to the scoring one. Rather than there being a darker area, then pale, it goes dark, paler, darkest, palest.
Lees, Mbye, Batchelor and Knowles being an intermediate colour makes sense because they're props and other forwards who are rotated on and off (not to mention the various cards). I think the mixing of the patches rather than the clear separation seen in the "present when point-scoring" matrix is because Percival is no longer hauled off at minute 50.
On the other hand, the "present when Saints concede" network graph looks more reasonable than the scoring one.
( Below the cut )