Game 25 in 2024 was an unfortunate loss to Hull KR - https://www.saintsrlfc.com/matches/2024/first-team/saints-v-hull-kr-2024-08-24-2/?swcfpc=1
I don't care that Hull KR were the coming force, I don't like losing to them. Blake getting a yellow card and then Makinson getting a red didn't help, although I'm pleased that Whitby got his first try and conversion (and on his debut too).
The game-specific figures don't really add much so I'm not sharing them.
Whitby's two point-scoring moments move him to the bottom of the middle of the "who scores for Saints?" diagram.

That might be a bad sign that either Saints's scoring pool wasn't diverse in 2024, or that they needed to score more points.
When do Saints score?

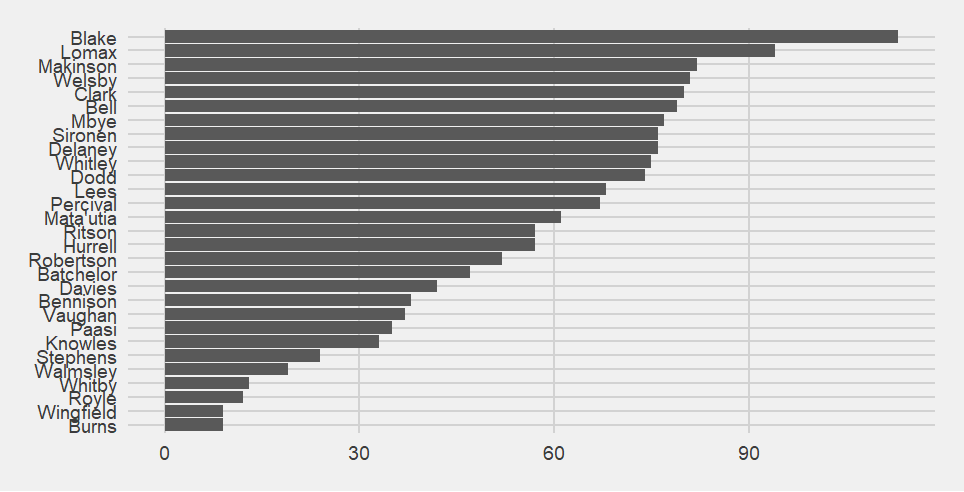
That Saints didn't score while Blake or Makinson were off the pitch due to their cards means they maintain their positions on the "Who is present when Saints score?" chart.
The matrix chart is back to being dark in one corner (bottom right) fading as it goes up and left.

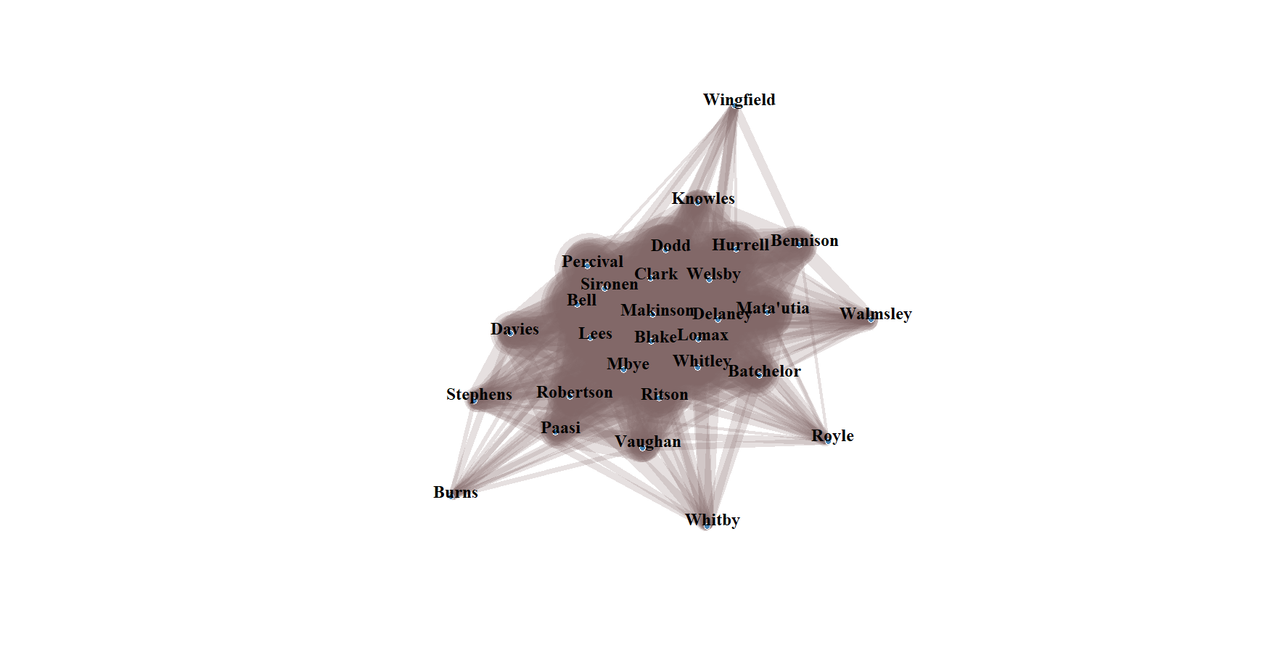
The network graph, interestingly, doesn't quite match. Whitby and Vaughan aren't present on the network graph, and Bennison is clearly outside the "frequently plays together" central blob, while he's in the second darkest area of the matrix chart. Davies has moved the other way.
In an amusing coincidence, both matches vs Hull KR in 2024 featured Hull KR having the same number of point-scoring moments.

When do Saints concede?
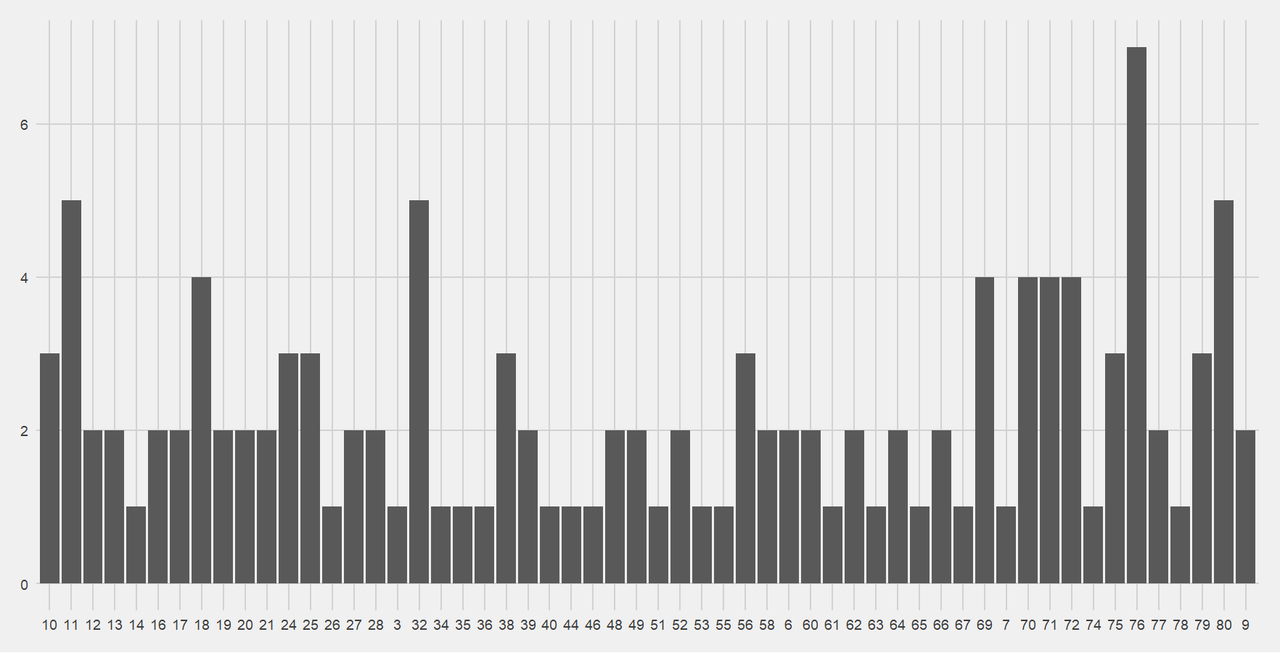
The evidence for "in the last 10 minutes" is really building up.
Who is present when Saints concede?
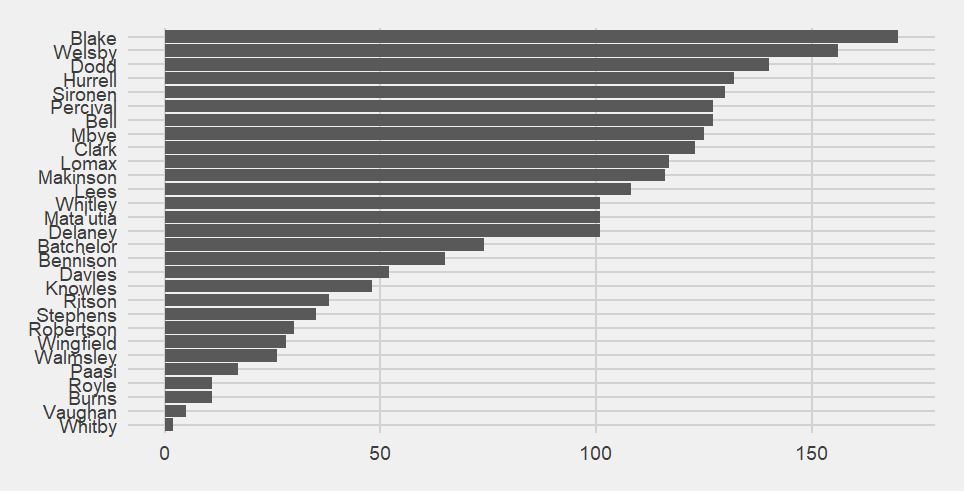
Understandably, because he is also present for the most scoring moments, Blake is top of this chart. There's a large drop off until you hit Lomax in second.
The "who is present when Saints concede" matrix looks like the top left quadrant of a Roman mosaic of the sun. If nothing else, it's pretty.
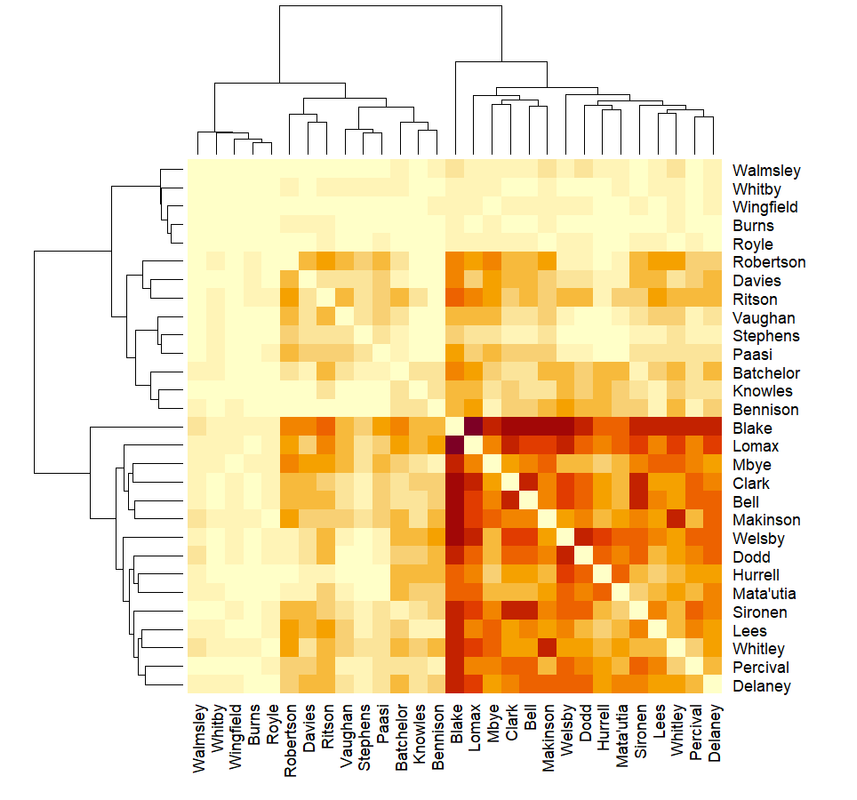
I think it looks like that because of how often Blake played with some of the "second most frequently playing" cluster of players (Robertson, Davies, Ritson, Vaughan, Stephens, Paasi, Batchelor, Knowles and Bennison).
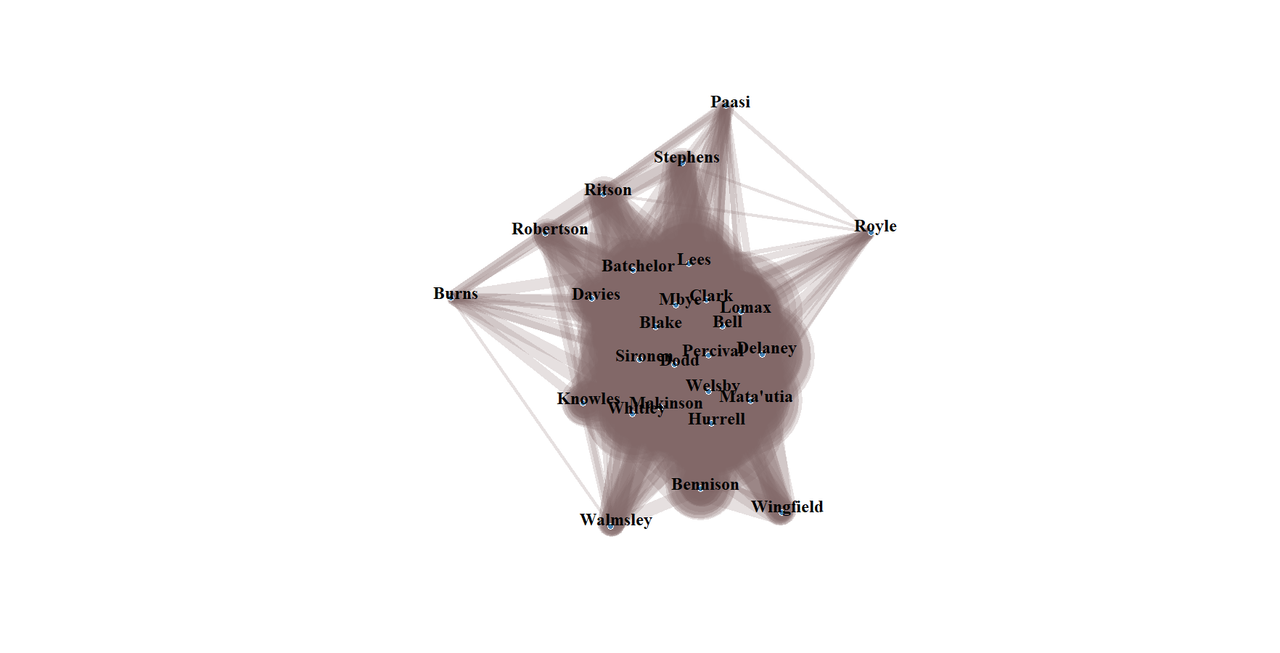
The network graph is less spread out than equivalent one for point-scoring moments, with most players being in the central blob. The players that stick out are Wingfield, Walmsley, Royle, Whitby and Burns. Although there are a ring of players that are either coming out of the main blob or being eaten by it (Knowles, Bennison, Batchelor, Vaughan, Paasi, Stephens and Davies)
I don't care that Hull KR were the coming force, I don't like losing to them. Blake getting a yellow card and then Makinson getting a red didn't help, although I'm pleased that Whitby got his first try and conversion (and on his debut too).
The game-specific figures don't really add much so I'm not sharing them.
Whitby's two point-scoring moments move him to the bottom of the middle of the "who scores for Saints?" diagram.
That might be a bad sign that either Saints's scoring pool wasn't diverse in 2024, or that they needed to score more points.
When do Saints score?
That Saints didn't score while Blake or Makinson were off the pitch due to their cards means they maintain their positions on the "Who is present when Saints score?" chart.
The matrix chart is back to being dark in one corner (bottom right) fading as it goes up and left.
The network graph, interestingly, doesn't quite match. Whitby and Vaughan aren't present on the network graph, and Bennison is clearly outside the "frequently plays together" central blob, while he's in the second darkest area of the matrix chart. Davies has moved the other way.
In an amusing coincidence, both matches vs Hull KR in 2024 featured Hull KR having the same number of point-scoring moments.
When do Saints concede?
The evidence for "in the last 10 minutes" is really building up.
Who is present when Saints concede?
Understandably, because he is also present for the most scoring moments, Blake is top of this chart. There's a large drop off until you hit Lomax in second.
The "who is present when Saints concede" matrix looks like the top left quadrant of a Roman mosaic of the sun. If nothing else, it's pretty.
I think it looks like that because of how often Blake played with some of the "second most frequently playing" cluster of players (Robertson, Davies, Ritson, Vaughan, Stephens, Paasi, Batchelor, Knowles and Bennison).
The network graph is less spread out than equivalent one for point-scoring moments, with most players being in the central blob. The players that stick out are Wingfield, Walmsley, Royle, Whitby and Burns. Although there are a ring of players that are either coming out of the main blob or being eaten by it (Knowles, Bennison, Batchelor, Vaughan, Paasi, Stephens and Davies)