Because I ended up a bit behind, I knew that adding the Challenge Cup to the visualisations wouldn't make a huge difference, because Saints only played two games, and lost to Warrington in the quarterfinal.
Losing to Warrington in the Challenge Cup is less humiliating than losing to them in the league, but that doesn't make it okay.
(Match reports here (https://www.saintsrlfc.com/2024/04/14/saints-beaten-in-challenge-cup-quarter-finals/) or here (https://www.theguardian.com/sport/2024/apr/14/warringtons-second-half-onslaught-knocks-st-helens-out-of-challenge-cup). Possibly L needs to be nicer about George Williams.)
Saints conceded enough that there was actually a network graph for players present when they concede.
Which suggests only bad things about the number of times Warrington scored.
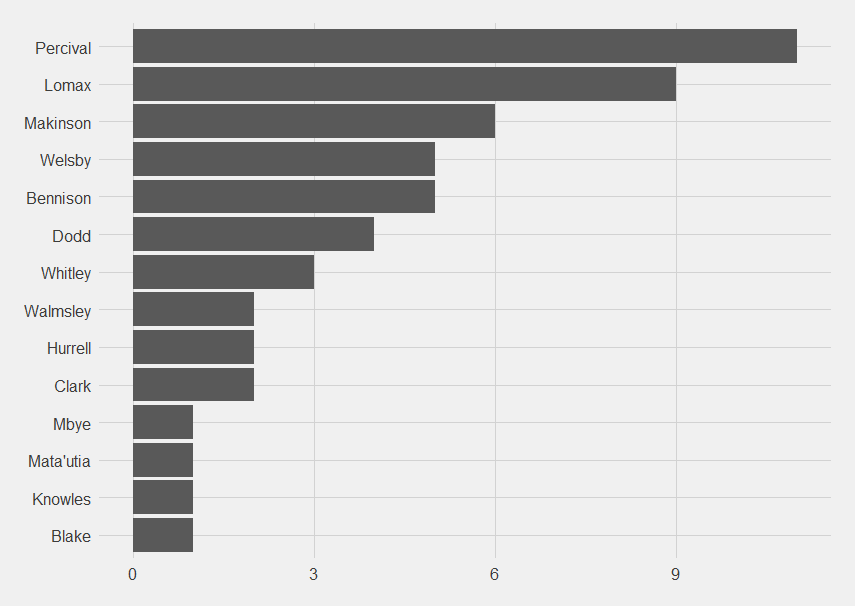
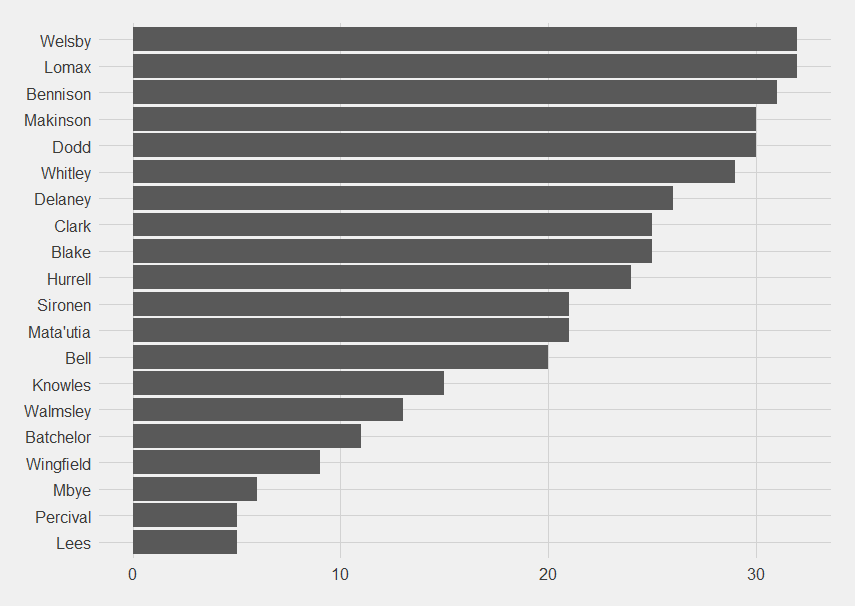
Percival has still scored the most, followed by Lomax and Makinson.
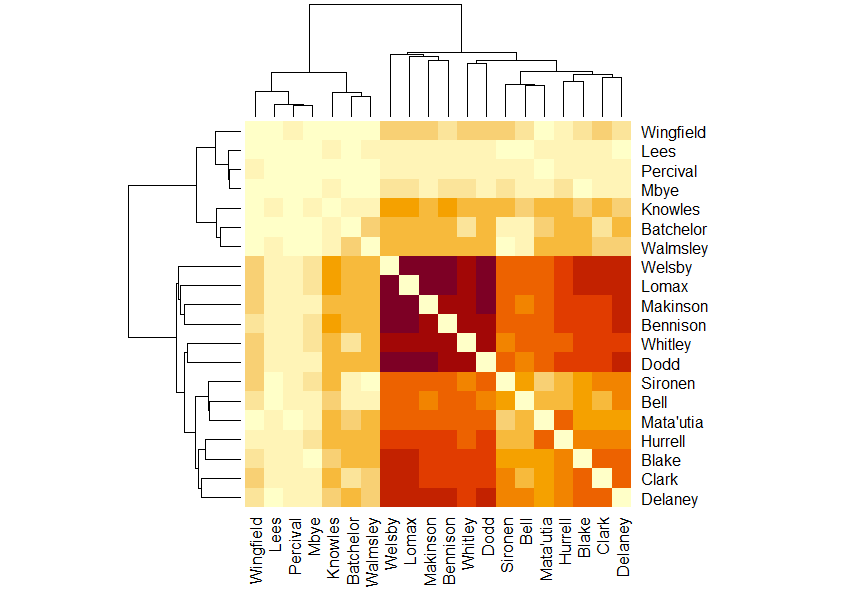
Whitley has now missed one point-scoring moment but he's still in the deepest purple section of the who plays together when Saints score matrix.
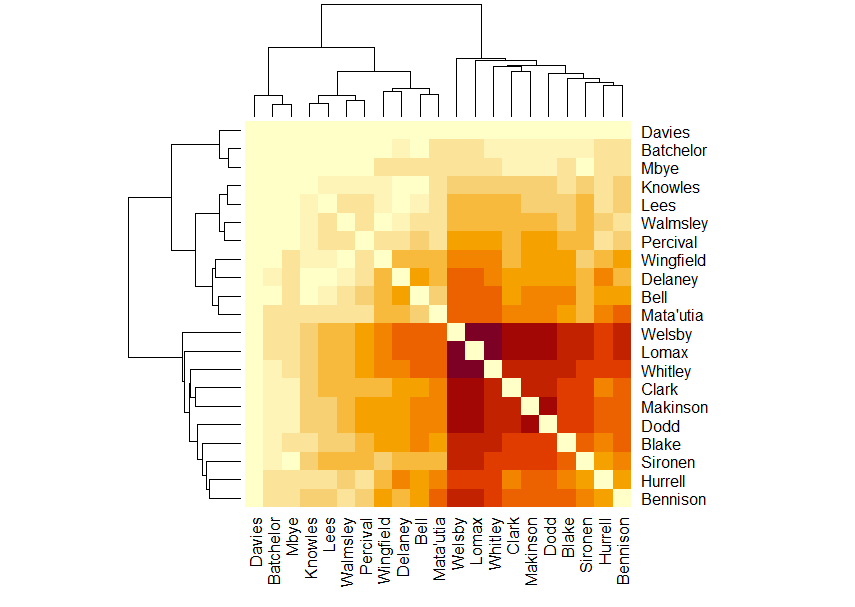
After the Whitley, Lomax and Welsby group, the next most commonly together are Dodd, Makinson and Clark in red.
The ones that are less frequently together than you might expect are
Sironen and Whitley
Bennison, Delaney and Walmsley (Bennison is together with Welsby and Lomax more often than expected)
Clark is together less often than expected with Bell, Wingfield and Percival.
Whitley, Delaney and Batchelor
Hurrell and Clark (although Hurrell's together with Delaney more than you might expect)
Blake and Mata'utia (Blake is together more than you'd expect with Bell)
Mata'utia is where the figure really splits between the frequently play together and less so. I think Percival is in that group because of his suspension.
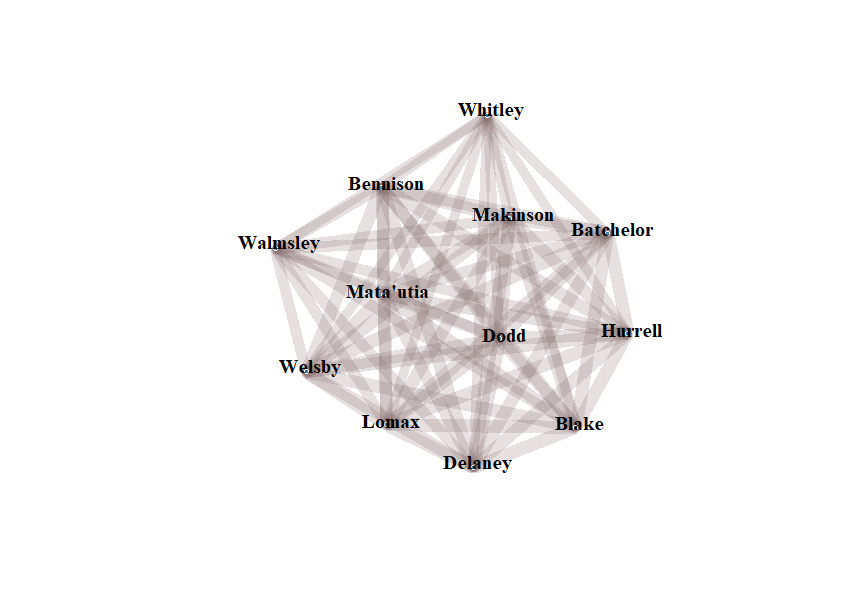
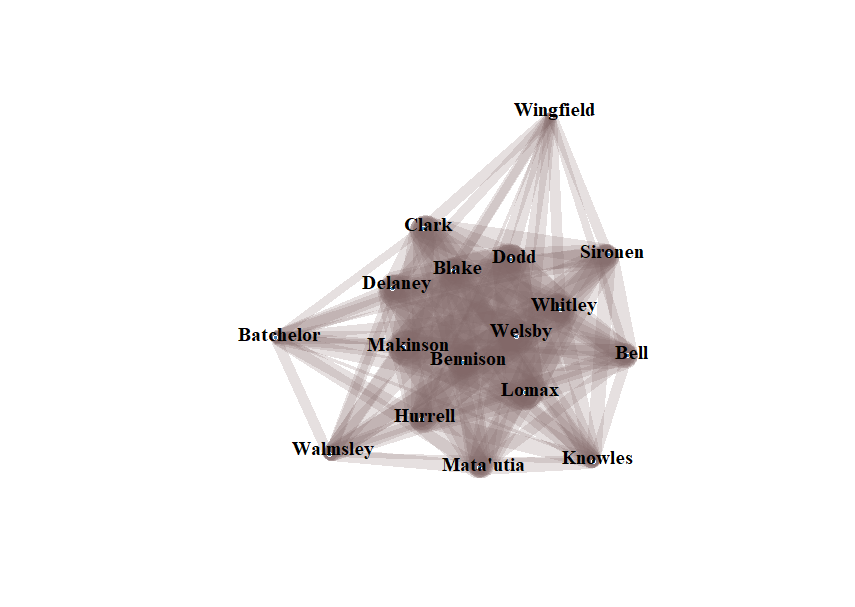
The "who is present when Saints score" network graph now looks spectacularly weird.
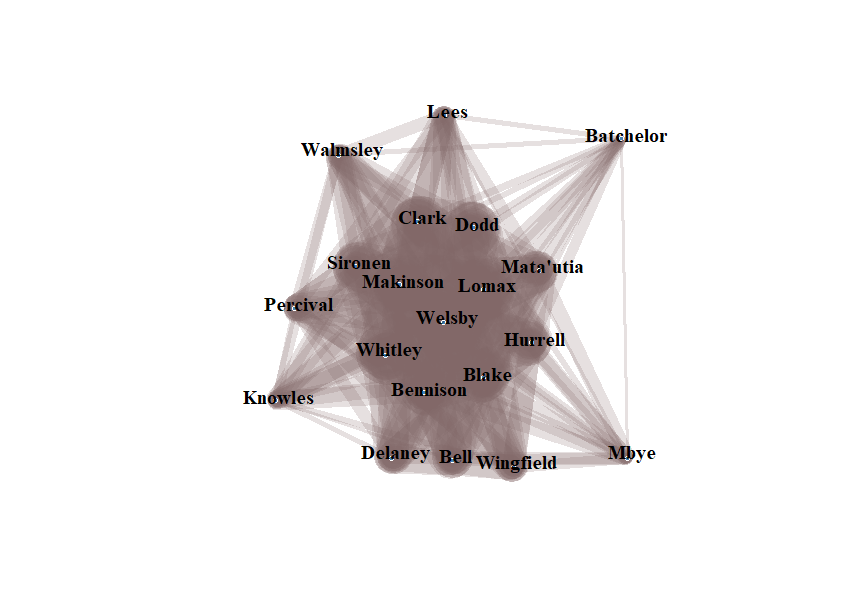
Lomax, Welsby and Makinson are the central core. The surrounding players are Clark, Dodd, Mata'utia, Hurrell, Blake, Bennison, Whitley and Sironen.
Percival forms the link between that central group and the outer group (again I think that's because of his suspension) who are, clockwise from Percival, Walmsley, Lees, Batchelor, Mbye, Wingfield, Bell, Delaney and Knowles.
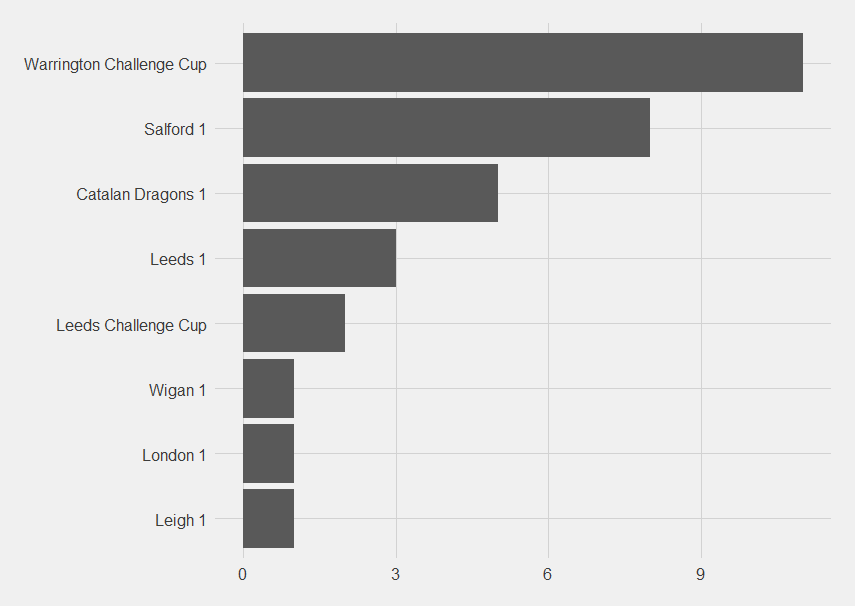
In the Challenge Cup quarterfinal, Warrington had the most point-scoring moments of any team so far.
As to when Saints concede there is starting to be a pattern of conceding the last 20 minutes of the game.
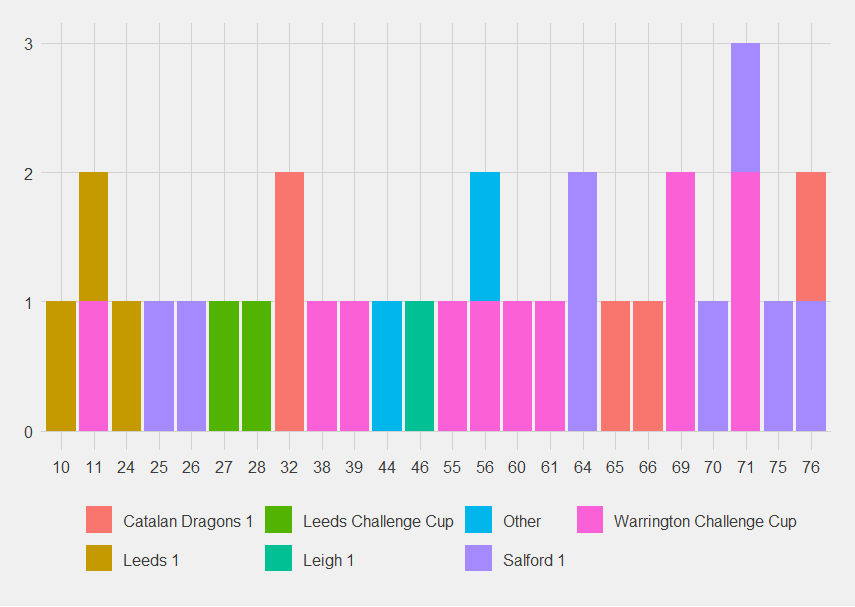
I'm presuming this is as the team gets tired out.
Who is present when Saints concede?
Combining the info from the last graph and this, I think Percival is so low down because when he plays, Saints tend to take him off around minute 50, so before the high concession time begins.
The matrix diagram shows that Whitley is present for fewer point-conceding moments than you'd expect.
There are now 17 players in the network graph.
I think Wingfield is sticking out up there because he's been out injured so long.
Losing to Warrington in the Challenge Cup is less humiliating than losing to them in the league, but that doesn't make it okay.
(Match reports here (https://www.saintsrlfc.com/2024/04/14/saints-beaten-in-challenge-cup-quarter-finals/) or here (https://www.theguardian.com/sport/2024/apr/14/warringtons-second-half-onslaught-knocks-st-helens-out-of-challenge-cup). Possibly L needs to be nicer about George Williams.)
Saints conceded enough that there was actually a network graph for players present when they concede.
Which suggests only bad things about the number of times Warrington scored.
Percival has still scored the most, followed by Lomax and Makinson.
Whitley has now missed one point-scoring moment but he's still in the deepest purple section of the who plays together when Saints score matrix.
After the Whitley, Lomax and Welsby group, the next most commonly together are Dodd, Makinson and Clark in red.
The ones that are less frequently together than you might expect are
Sironen and Whitley
Bennison, Delaney and Walmsley (Bennison is together with Welsby and Lomax more often than expected)
Clark is together less often than expected with Bell, Wingfield and Percival.
Whitley, Delaney and Batchelor
Hurrell and Clark (although Hurrell's together with Delaney more than you might expect)
Blake and Mata'utia (Blake is together more than you'd expect with Bell)
Mata'utia is where the figure really splits between the frequently play together and less so. I think Percival is in that group because of his suspension.
The "who is present when Saints score" network graph now looks spectacularly weird.
Lomax, Welsby and Makinson are the central core. The surrounding players are Clark, Dodd, Mata'utia, Hurrell, Blake, Bennison, Whitley and Sironen.
Percival forms the link between that central group and the outer group (again I think that's because of his suspension) who are, clockwise from Percival, Walmsley, Lees, Batchelor, Mbye, Wingfield, Bell, Delaney and Knowles.
In the Challenge Cup quarterfinal, Warrington had the most point-scoring moments of any team so far.
As to when Saints concede there is starting to be a pattern of conceding the last 20 minutes of the game.
I'm presuming this is as the team gets tired out.
Who is present when Saints concede?
Combining the info from the last graph and this, I think Percival is so low down because when he plays, Saints tend to take him off around minute 50, so before the high concession time begins.
The matrix diagram shows that Whitley is present for fewer point-conceding moments than you'd expect.
There are now 17 players in the network graph.
I think Wingfield is sticking out up there because he's been out injured so long.